Compensation
Median annual compensation varies across the five surveyed markets, reflecting differences in cost of living, market maturity, and demand for design talent. In local currency terms, the medians are:
- Indonesia: IDR 92.35 million
- Singapore: SGD 79,200
- Malaysia: MYR 97,200
- Vietnam: VND 260 million
- Thailand: THB 652,000
Indonesia, Singapore, and Malaysia have per-level cohorts deep enough to break out a compensation range by career level; Vietnam and Thailand's cohorts thin out beyond Senior IC and remain published as distribution charts below.
Chart proof
Currency distribution for pay
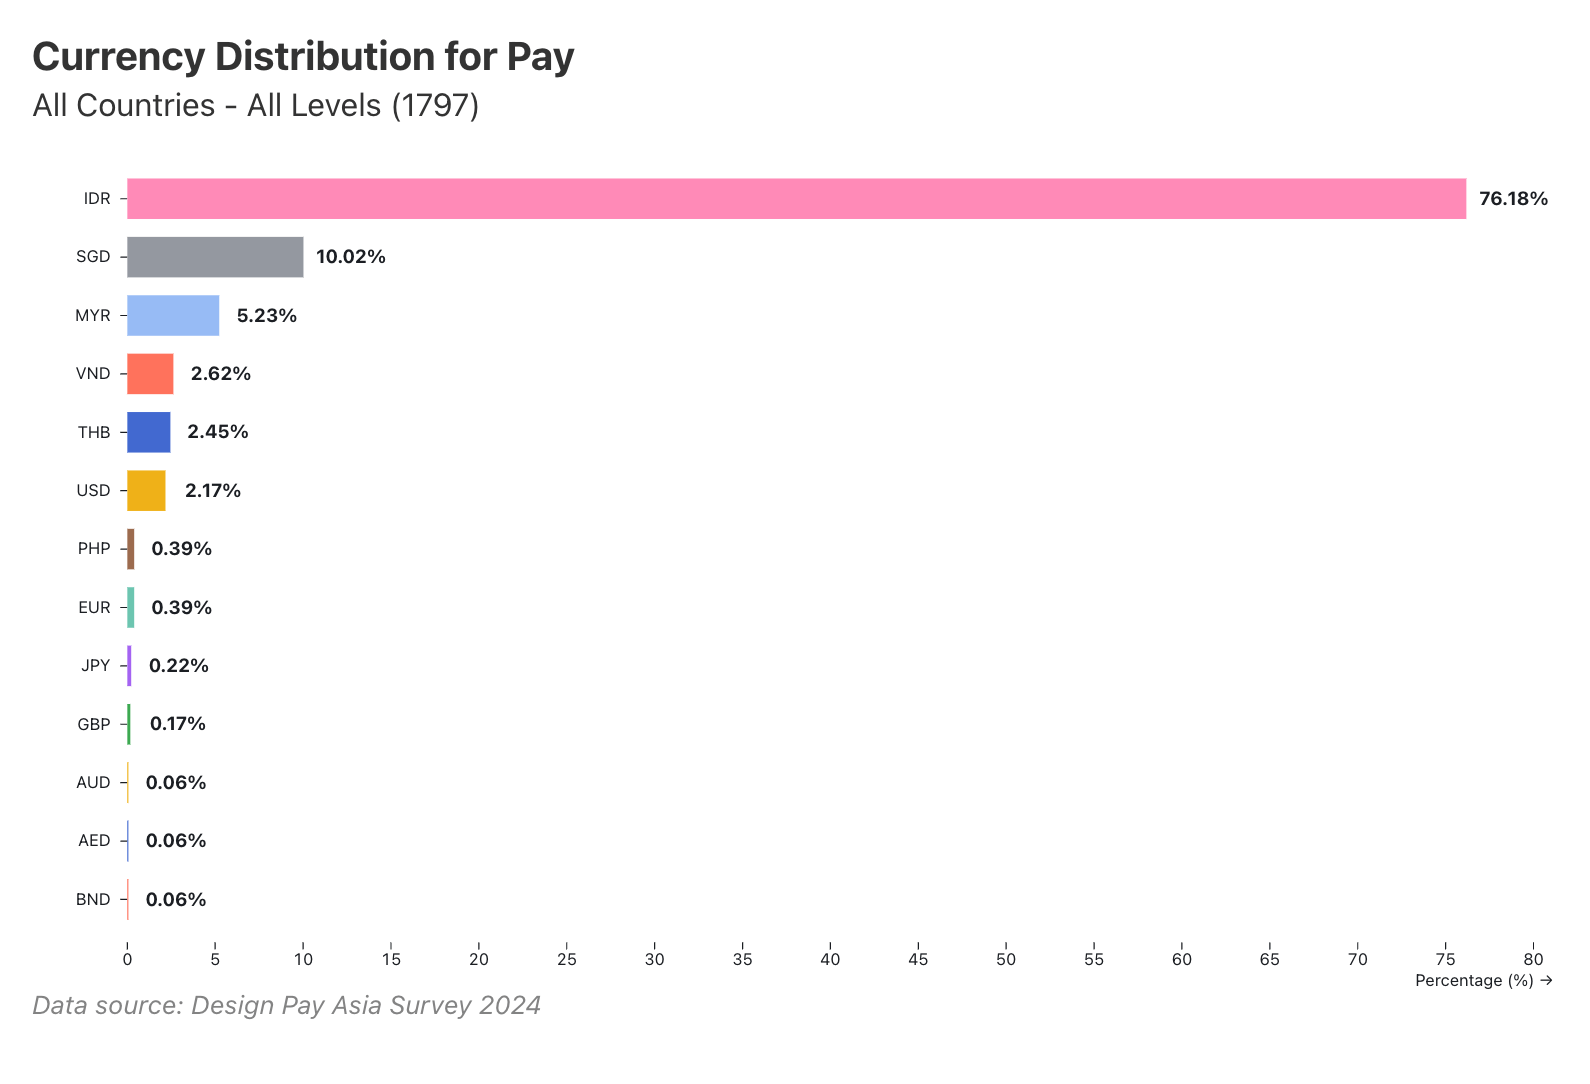
Breakdown of currencies used to report compensation across 13 currencies; the smallest three (AUD, AED, BND) each round to 0.06%. Based on N=1,797 responses.
76.18% of pay is reported in Indonesian Rupiah, followed by SGD (10.02%) and MYR (5.23%); the remaining ten currencies each account for under 3%.
View data table
| Currency | Share of total payments |
|---|---|
| IDR (Indonesian Rupiah) | 76.18% |
| SGD (Singapore Dollar) | 10.02% |
| MYR (Malaysian Ringgit) | 5.23% |
| VND (Vietnamese Dong) | 2.62% |
| THB (Thai Baht) | 2.45% |
| USD | 2.17% |
| PHP (Philippine Peso) | 0.39% |
| EUR | 0.39% |
| JPY | 0.22% |
| GBP | 0.17% |
| AUD | 0.06% |
| AED | 0.06% |
| BND | 0.06% |
In much of the region, a designer's next salary is still anchored to their last one.
Chart proof
Base salary sharing preferences
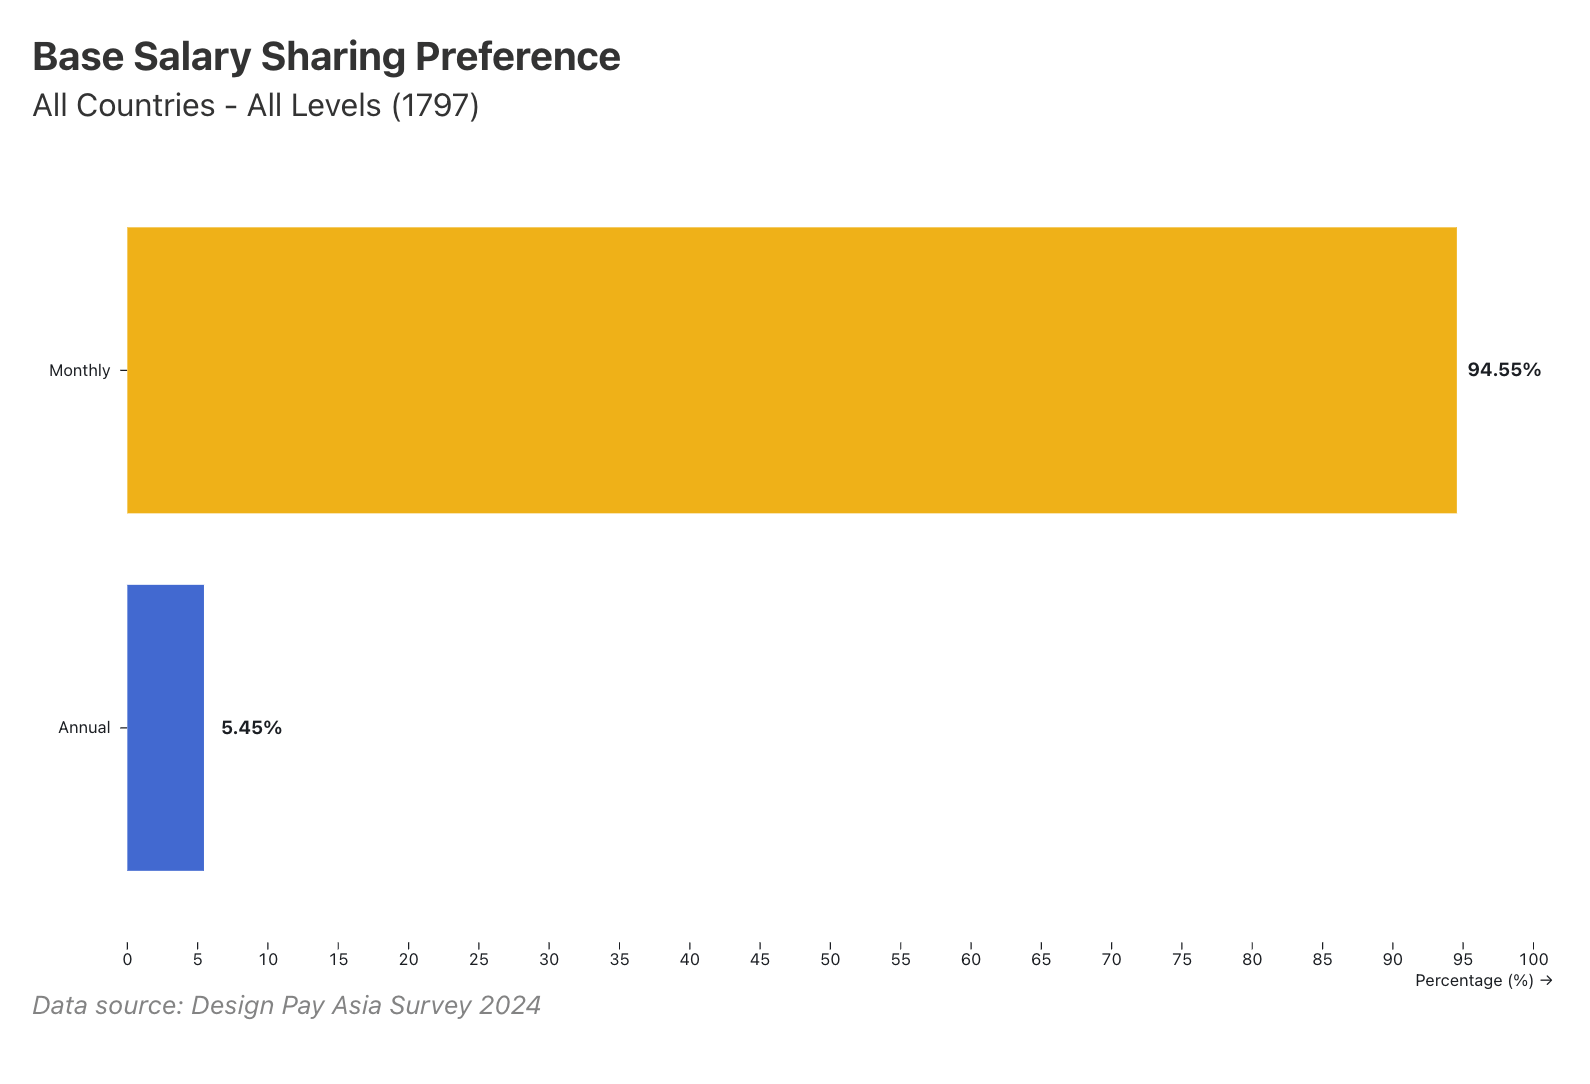
Preference for monthly versus annual pay reporting across all respondents (N=1,797).
94.55% of designers report pay on a monthly basis, reflecting the standard Southeast Asian compensation practice.
View data table
| Reporting format | Respondents (n) | Proportion |
|---|---|---|
| Monthly | 1,699 | 94.55% |
| Annual | 98 | 5.45% |
Indonesia and Singapore's ranges widen sharply above Senior IC; Malaysia's stay comparatively tight through Lead / Staff / Principal IC, the highest level it can publish.
Chart proof
Annual total compensation by level of seniority
Minimum, median, and maximum annual total compensation by career level, Indonesia, Singapore, and Malaysia. Cohorts below the minimum safe disclosure threshold of 10 respondents are excluded: Indonesia Director/VP (N=6); Singapore Director/VP (N=2) and Head of department / Senior leadership (N=5); Malaysia Manager (N=4), Director/VP (N=6), and Head of department / Senior leadership (N=2).
Indonesia's ranges are the widest in the region, and they broaden sharply with seniority. Director/VP (n=6) falls below the 10-respondent disclosure threshold and is not shown.
Outlier tops out at Rp1,440M
View data table
| Career level | n | Minimum (Rp) | Median (Rp) | Maximum (Rp) |
|---|---|---|---|---|
| Junior IC | 296 | 6,000,000 | 66,000,000 | 240,000,000 |
| Mid-level IC | 611 | 4,000,000 | 90,000,000 | 768,000,000 |
| Senior IC | 262 | 10,000,000 | 130,000,000 | 1,440,000,000 |
| Lead / Staff / Principal IC | 136 | 22,000,000 | 133,000,000 | 686,000,000 |
| Manager | 40 | 23,000,000 | 256,000,000 | 632,000,000 |
| Head of department / Senior leadership | 15 | 19,000,000 | 195,000,000 | 1,420,000,000 |
Singapore's progression is more even than Indonesia's up to Senior IC, where variance widens. Director/VP (n=2) and Head of department / Senior leadership (n=5) fall below the 10-respondent disclosure threshold and are not shown.
Outlier reaches S$434K
View data table
| Career level | n | Minimum (S$) | Median (S$) | Maximum (S$) |
|---|---|---|---|---|
| Junior IC | 40 | 6,000 | 60,000 | 190,000 |
| Mid-level IC | 54 | 30,000 | 72,000 | 165,000 |
| Senior IC | 45 | 44,000 | 103,000 | 434,000 |
| Lead / Staff / Principal IC | 12 | 39,000 | 120,000 | 246,000 |
| Manager | 13 | 54,000 | 133,000 | 267,000 |
Malaysia's publishable cohorts thin out earlier than Indonesia's or Singapore's. Manager (n=4), Director/VP (n=6), and Head of department / Senior leadership (n=2) fall below the 10-respondent disclosure threshold and are not shown, despite Director/VP carrying the highest published median in the region (RM353,000) before suppression.
Outlier reaches RM317K
View data table
| Career level | n | Minimum (RM) | Median (RM) | Maximum (RM) |
|---|---|---|---|---|
| Junior IC | 15 | 24,000 | 42,000 | 72,000 |
| Mid-level IC | 26 | 40,000 | 76,000 | 180,000 |
| Senior IC | 22 | 68,000 | 108,000 | 240,000 |
| Lead / Staff / Principal IC | 16 | 46,000 | 154,000 | 317,000 |
Chart proof
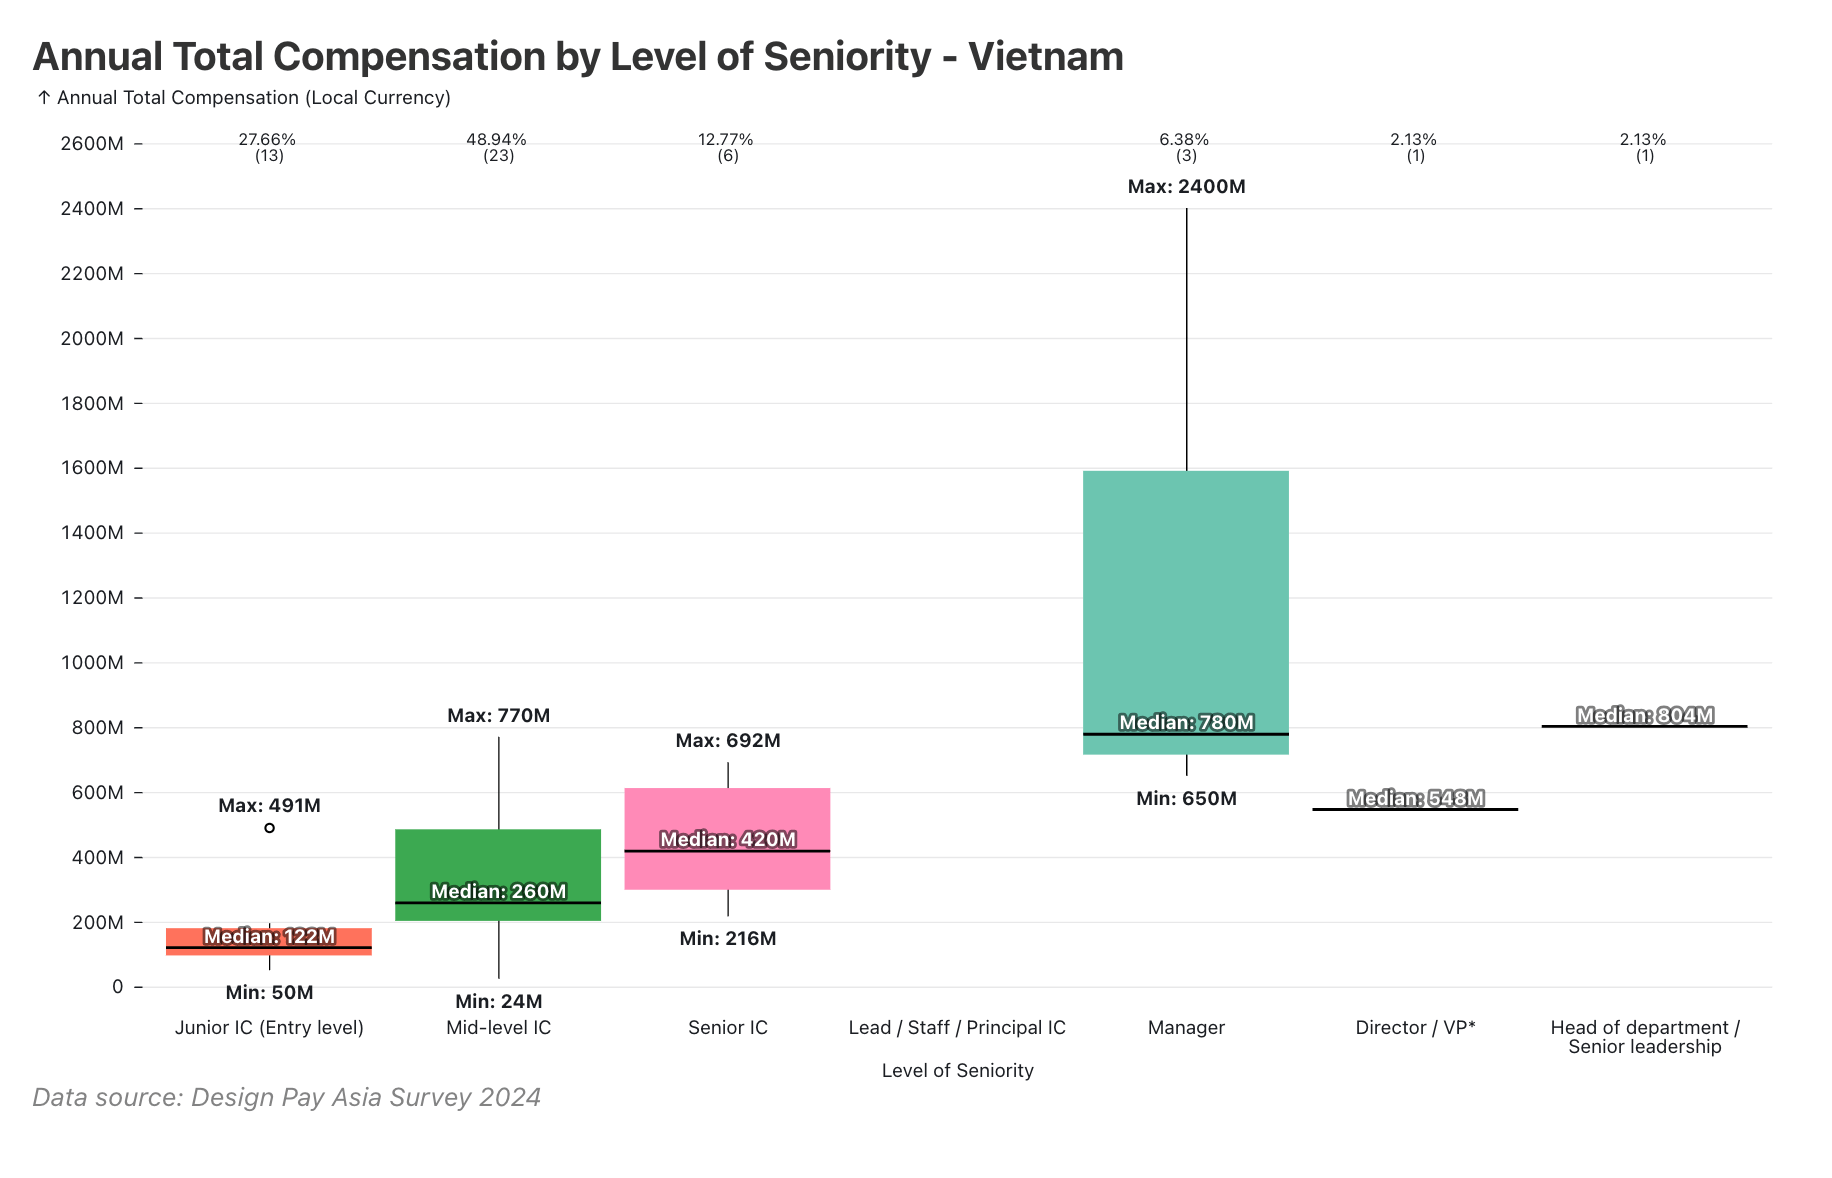
Annual total compensation by level of seniority in Vietnam
Bar/distribution plot of annual compensation (VND) by seniority level among Vietnamese designers.
Manager roles in Vietnam command a near-double premium over Senior IC (VND 780M vs 420M), based on 47 respondents.
View data table
| Level | Median (VND) |
|---|---|
| Junior IC | 122M |
| Mid-level IC | 260M |
| Senior IC | 420M |
| Manager | 780M |
| Head/Senior Leadership | 804M |
Chart proof
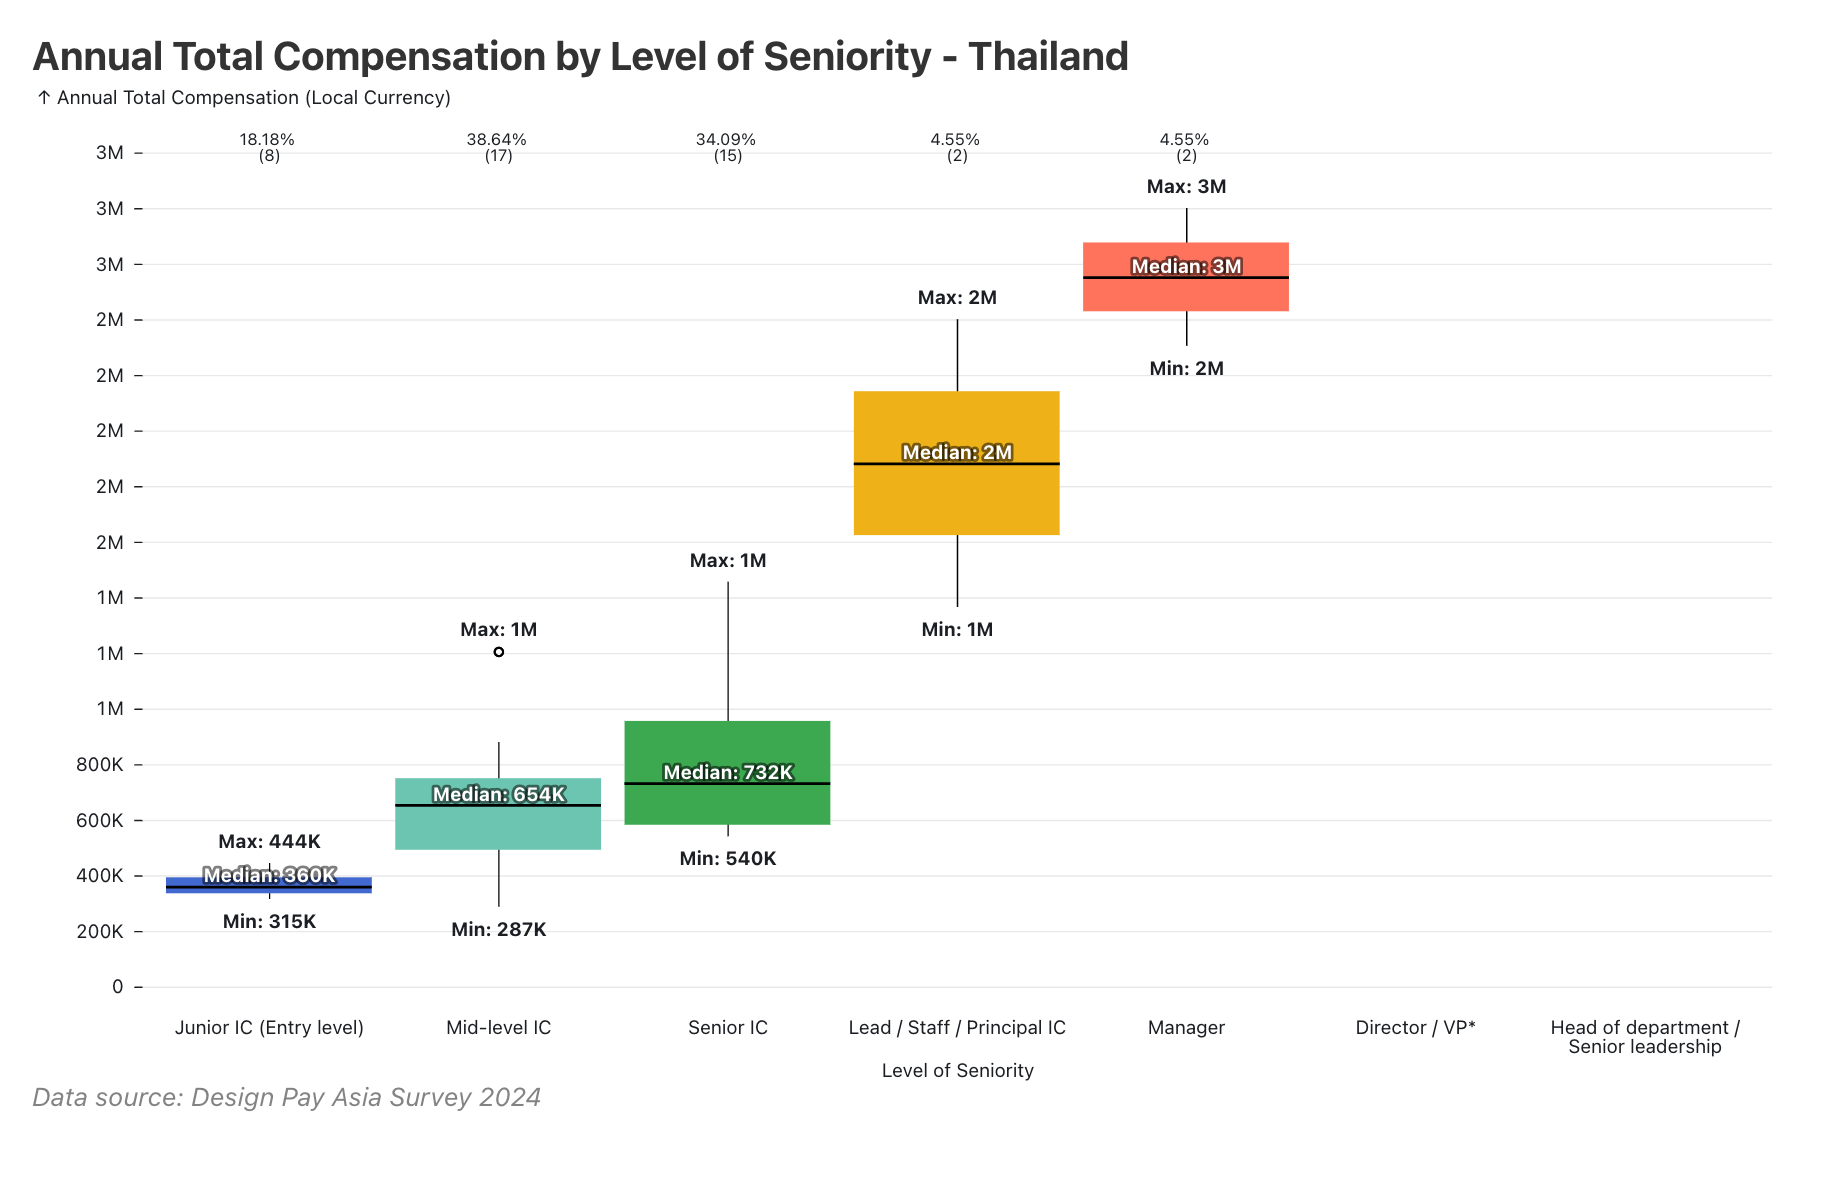
Annual total compensation by level of seniority in Thailand
Bar/distribution plot of annual compensation (THB) by seniority level among Thai designers.
Thai IC roles are tightly concentrated (95.46% of respondents), with clear steps from Junior IC (360K THB) to Senior IC (732K THB), based on 44 respondents.
View data table
| Level | Median (THB) |
|---|---|
| Junior IC | 360K |
| Mid-level IC | 654K |
| Senior IC | 732K |
| Lead/Staff | 2M |
| Manager | 3M |
Chart proof
Base salary share by seniority level
Base salary as a percentage of total compensation across seniority levels, showing the shift toward variable pay at higher levels. Based on N=1,797 responses.
Base salary's share of total compensation declines from 90.5% at junior IC to 83.7% at head of design as variable pay grows with seniority.
View data table
| Seniority Level | Base Salary % |
|---|---|
| Junior IC | 90.5% |
| Mid-level IC | 90.2% |
| Senior IC | 88.4% |
| Lead/Staff IC | 85.6% |
| Manager | 84.3% |
| Director/VP | 85.1% |
| Head of Design | 83.7% |
Variable pay does not grow evenly with seniority:
- Base salary's share dips sharpest at manager level, before edging back up for Director/VP
- Stock grants reach their highest share, 4.3%, at head of design
- Bonuses peak earlier, at 11.3% for senior leadership
Chart proof
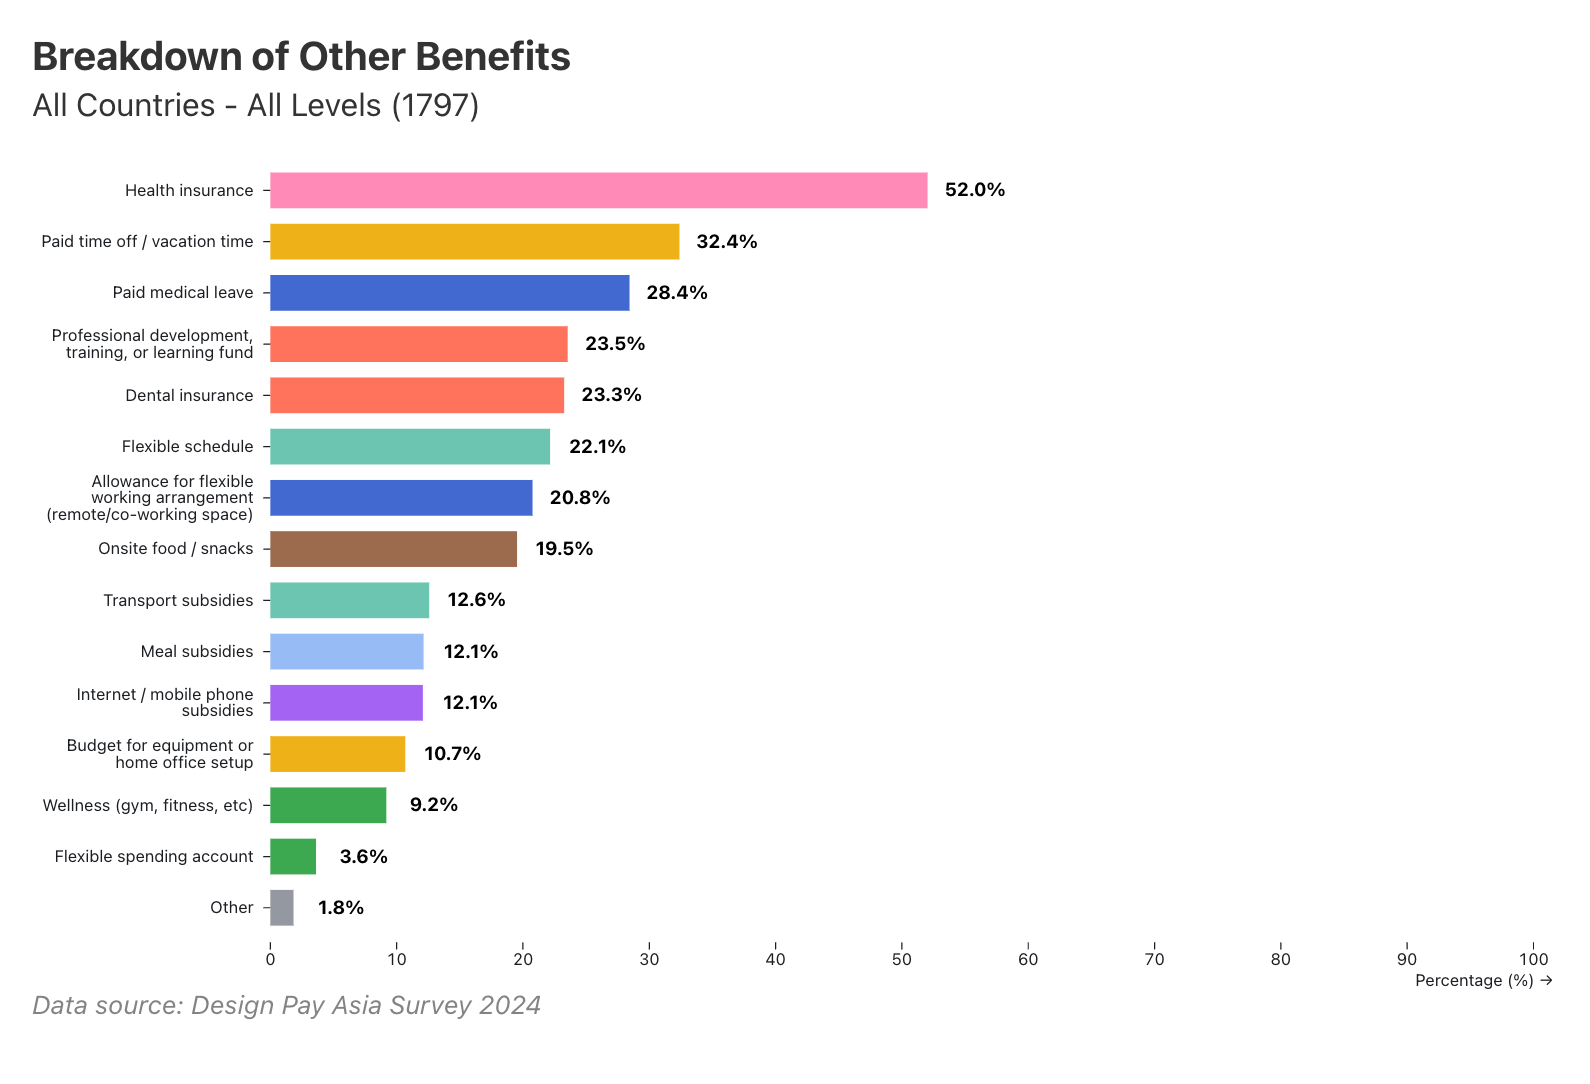
Breakdown of other benefits
Distribution of non-salary benefits offered across Southeast Asian design roles (N=1,797).
Health insurance is the most common benefit, offered to 52.0% of designers.
View data table
| Benefit | Respondents (n) | Proportion |
|---|---|---|
| Health insurance | 935 | 52.0% |
| Paid time off / vacation time | 582 | 32.4% |
| Paid medical leave | 511 | 28.4% |
| Professional development, training, or learning fund | 423 | 23.5% |
| Dental insurance | 418 | 23.3% |
| Flexible schedule | 398 | 22.1% |
| Allowance for flexible working arrangement (remote/co-working space) | 373 | 20.8% |
| Onsite food / snacks | 351 | 19.5% |
| Transport subsidies | 226 | 12.6% |
| Meal subsidies | 218 | 12.1% |
| Internet / mobile phone subsidies | 217 | 12.1% |
| Budget for equipment or home office setup | 192 | 10.7% |
| Wellness (gym, fitness, etc.) | 165 | 9.2% |
| Flexible spending account | 65 | 3.6% |
| Other | 33 | 1.8% |
Full-time versus contractors and freelancers, side by side
Nearly one in five people in the 2024 sample, 18.75% or roughly 337 designers, work as contractors or freelancers rather than employees. Until now their pay sat folded inside the market medians. Here it is on its own.
The comparison only holds within a single market and a single currency, so this reads market by market rather than as one regional number. Contractors and freelancers answered the same base-salary question as everyone else. These figures are their total annual compensation, taken as reported, and that annual total quietly assumes a full year of engagements. For someone who contracts, that assumption rarely holds: the number sits above what a year of uneven projects, unpaid gaps, self-funded healthcare, and the tax an employer would otherwise carry actually leaves in hand. Read it with that gap in mind. Cohorts too small to show safely are held back, and interns (n=35) are excluded from this comparison entirely.
Chart proof
Compensation by employment type
Median annual-equivalent compensation, full-time employees versus contractors and freelancers (n=337 combined: 247 fixed-term contractors plus 90 self-employed freelancers), within each market's own currency, at an all-levels aggregate grain rather than broken out by seniority. Figures are total annual compensation as reported; for contractors and freelancers the annual total assumes a full year of engagements, so it may overstate for those with unpaid gaps. Interns (n=35) are excluded. Cohorts below the 10-respondent disclosure threshold are not shown; Malaysia, Thailand, Vietnam, Japan, and the Philippines are named in the accompanying text rather than charted. Select a market to view its comparison.
Indonesia full-time (n=1,050) versus contractors and freelancers (n=286) median annual-equivalent compensation, all levels combined, in Indonesian Rupiah: contractors and freelancers earn a median of Rp80,620,000 against Rp97,200,000 for full-time employees. This is an all-levels aggregate, not a per-seniority-level comparison.
View data table
| Career level | Full-time median (Rp) | Contractors and freelancers median (Rp) |
|---|---|---|
| All levels | 97,200,000 | 80,620,000 |
Singapore full-time (n=150) versus contractors and freelancers (n=19) median annual-equivalent compensation, all levels combined, in Singapore Dollars: contractors and freelancers earn a median of S$66,000 against S$83,594 for full-time employees. This is an all-levels aggregate, not a per-seniority-level comparison.
View data table
| Career level | Full-time median (S$) | Contractors and freelancers median (S$) |
|---|---|---|
| All levels | 83,594 | 66,000 |
Contractor and freelancer cohorts in Malaysia, Thailand, Vietnam, Japan, and the Philippines fell below the 10-respondent disclosure threshold and are not broken out here.
Some cohorts here are too small to publish without identifying individuals, so we hold those figures back.
Malaysia, Thailand, Vietnam, Japan, and the Philippines are not shown: their contractor/freelancer cohorts fell below the 10-respondent disclosure threshold.
What this means for you
If you're a designer
- Whether a company rewards deep design expertise the same as it rewards management skills is worth checking, not assuming.
- Consider how you plan your career path based on impact as compared to just going up the career ladder.
- If you contract or freelance, read your annualised pay against these salaried medians with the gaps in mind. The annual figure assumes a full year of billable work, and benefits, unpaid time, and tax are yours to cover.
If you're leading a team or organisation
- Career paths for designers who want to stay hands-on rather than manage remain rare, even where the pay gap to management is steep.
- Be ready to show how your design team adds value to justify good pay.
- Check if your design team structure and pay matches how important design is to your business.
- Review if your pay ranges help you keep good designers.
- When you compare a contractor rate with a salaried band, load in the costs the salary already carries before deciding which is cheaper.
Evidence and further reading
Evidence used in this section
-
Regional compensation structure: 97% local currency, base-salary dominant, monthly reporting
Regional currency usage shows 97% of payments in Southeast Asian currencies (IDR 76.2%, SGD 10.0%, MYR 5.2%). Monthly pay reporting at 94.55%. Base salary dominates at 83% across all levels, with variable components increasing at senior positions (bonus up to 11.3% at Head level). Healthcare leads benefits at 52%, with growing focus on flexibility.
-
Median annual total compensation by country (2024)
Approximate median annual total compensation: Indonesia IDR 92.35M, Singapore SGD 79,200, Malaysia MYR 97,200, Vietnam VND 260M, Thailand THB 652,000. Wide variance at leadership levels across all markets.
-
Singapore compensation: SGD-dominated, structured pay mix, comprehensive benefits
SGD dominance at 98.3%, with monthly reporting at 94.6%. Base salary share decreases with seniority from 90.5% (Junior IC) to 83.7% (Head/Senior Leadership). Stock options peak at 4.3% for Heads, bonus peaks at 11.3% at Head level. Benefits are more comprehensive than region: Health insurance 52.0%, Leave benefits 32.4%, Professional development 23.5%, Dental 23.3%, Flexible work 22.1%, Transport 12.6%, Home office 10.7%.
-
Respondent geographic distribution heavily concentrated in Indonesia
Indonesia accounts for 79.0% (1,419) of respondents, followed by Singapore 9.7% (174), Malaysia 5.1% (92), Vietnam 2.9% (53), and Thailand 2.4% (44). Urban concentration is strong with Jakarta alone at 48.4%.
-
Annual-equivalent compensation by employment type (2024)
Median annual-equivalent compensation for full-time employees versus contractors and freelancers (fixed-term contractors plus self-employed freelancers, n=337 combined: 247 fixed-term contractors plus 90 self-employed freelancers), within each market's own currency, at an all-levels aggregate grain rather than broken out by seniority. Published only where both cohorts reached the 10-respondent threshold: Indonesia full-time Rp97,200,000 (n=1,050) versus contractors and freelancers Rp80,620,000 (n=286); Singapore full-time S$83,594 (n=150) versus contractors and freelancers S$66,000 (n=19). Interns (n=35) are excluded from this comparison.
Further reading and context
Questions worth exploring
Will we keep paying managers much more, or will we create better-paid roles for senior designers?
Worth exploring next
- How does basing new job offers on previous salary (plus 20%) affect the industry long term?
- What happens when managers must both lead and do design work themselves?
- How can companies pay fairly across different countries when teams work remotely?
- Once unbilled months are counted, can a freelance rate really match a salaried offer?
Where this sits in the conversation
-
Overview
2024 report -
Landscape
Demographics -
Landscape
Roles & experiences -
Landscape
Compensation you are here -
Landscape
Company landscape -
Sentiments
Offer & negotiation -
Sentiments
Career progression -
Sentiments
Value of design -
Sentiments
Job market -
Singapore deep dive
Singapore deep dive -
Close
The conversation continues
Commentary
Design pay and benefits look different market to market across Southeast Asia.