Company landscape
Enterprise organisations employ 32.8% of Singapore-based designers, against 20.8% regionally. Singapore's design workforce sits inside a more established employer base than the rest of the region does.
Chart proof
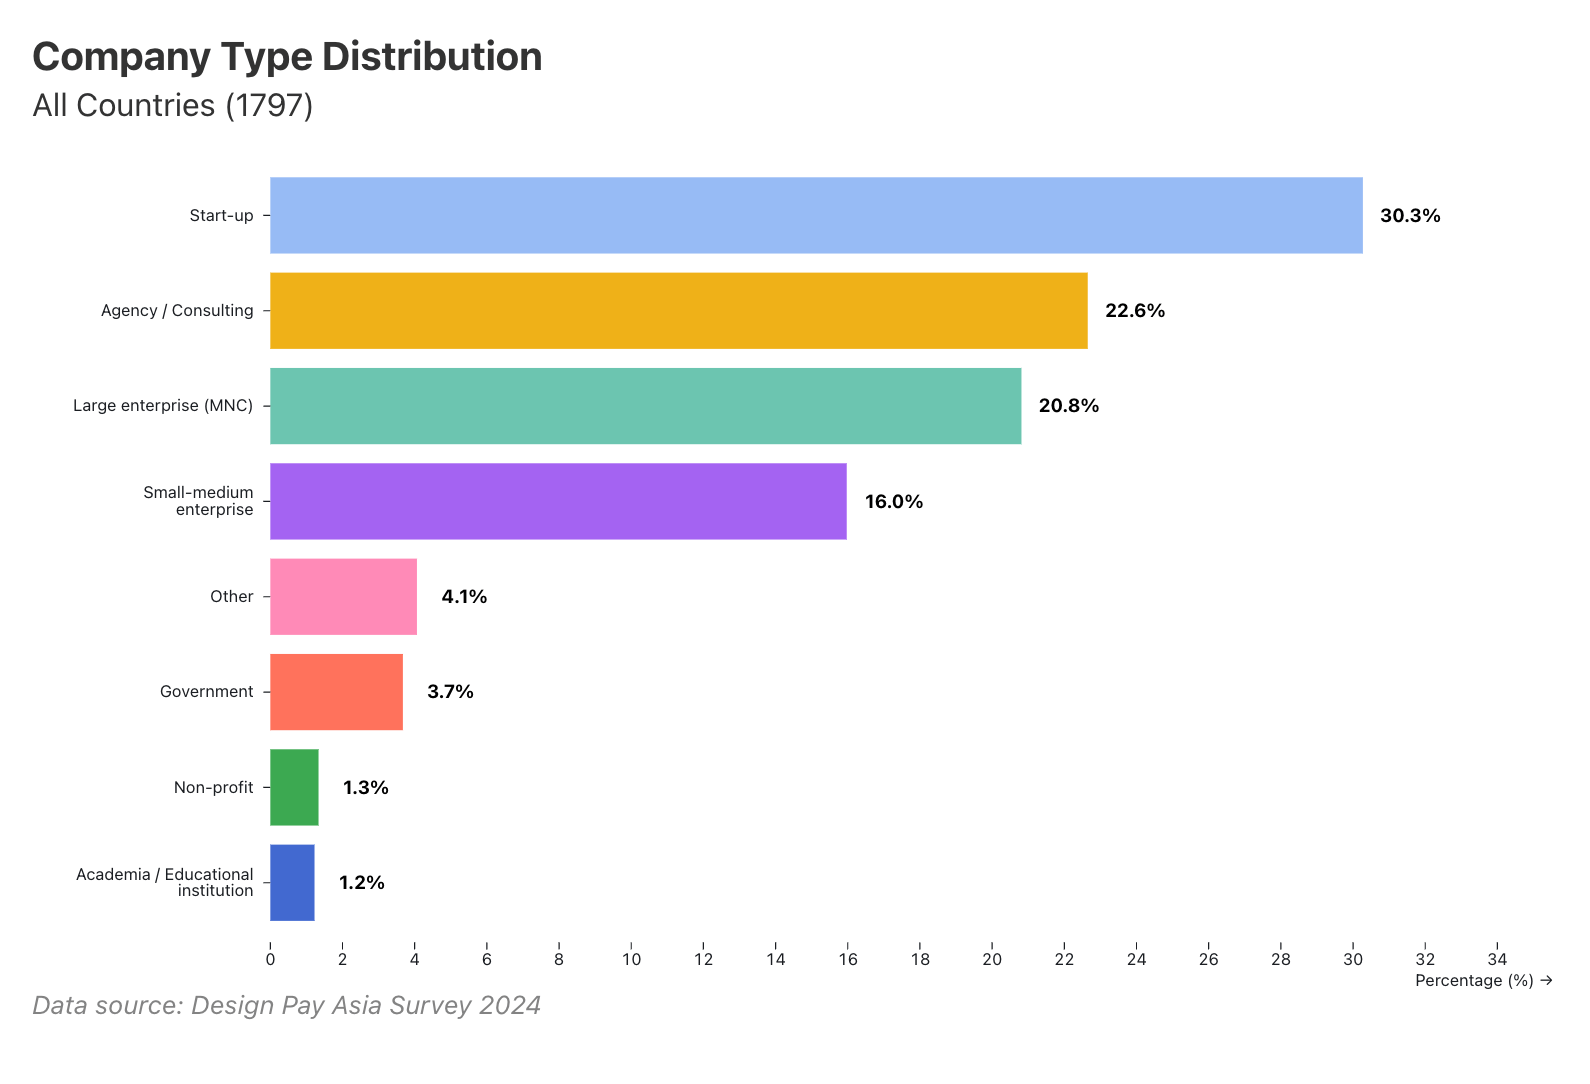
Company type distribution
Breakdown of company types employing designers across Southeast Asia.
Startups lead at 30.3%, followed by agencies/consulting (22.7%) and large enterprise (20.8%), with the commercial sector at 89.8% combined.
View data table
| Company type | Respondents (n) | Proportion |
|---|---|---|
| Startup | 544 | 30.3% |
| Agency/Consulting | 407 | 22.7% |
| Large enterprise | 374 | 20.8% |
| SME | 287 | 16.0% |
| Public/Education | 88 | 4.9% |
Chart proof
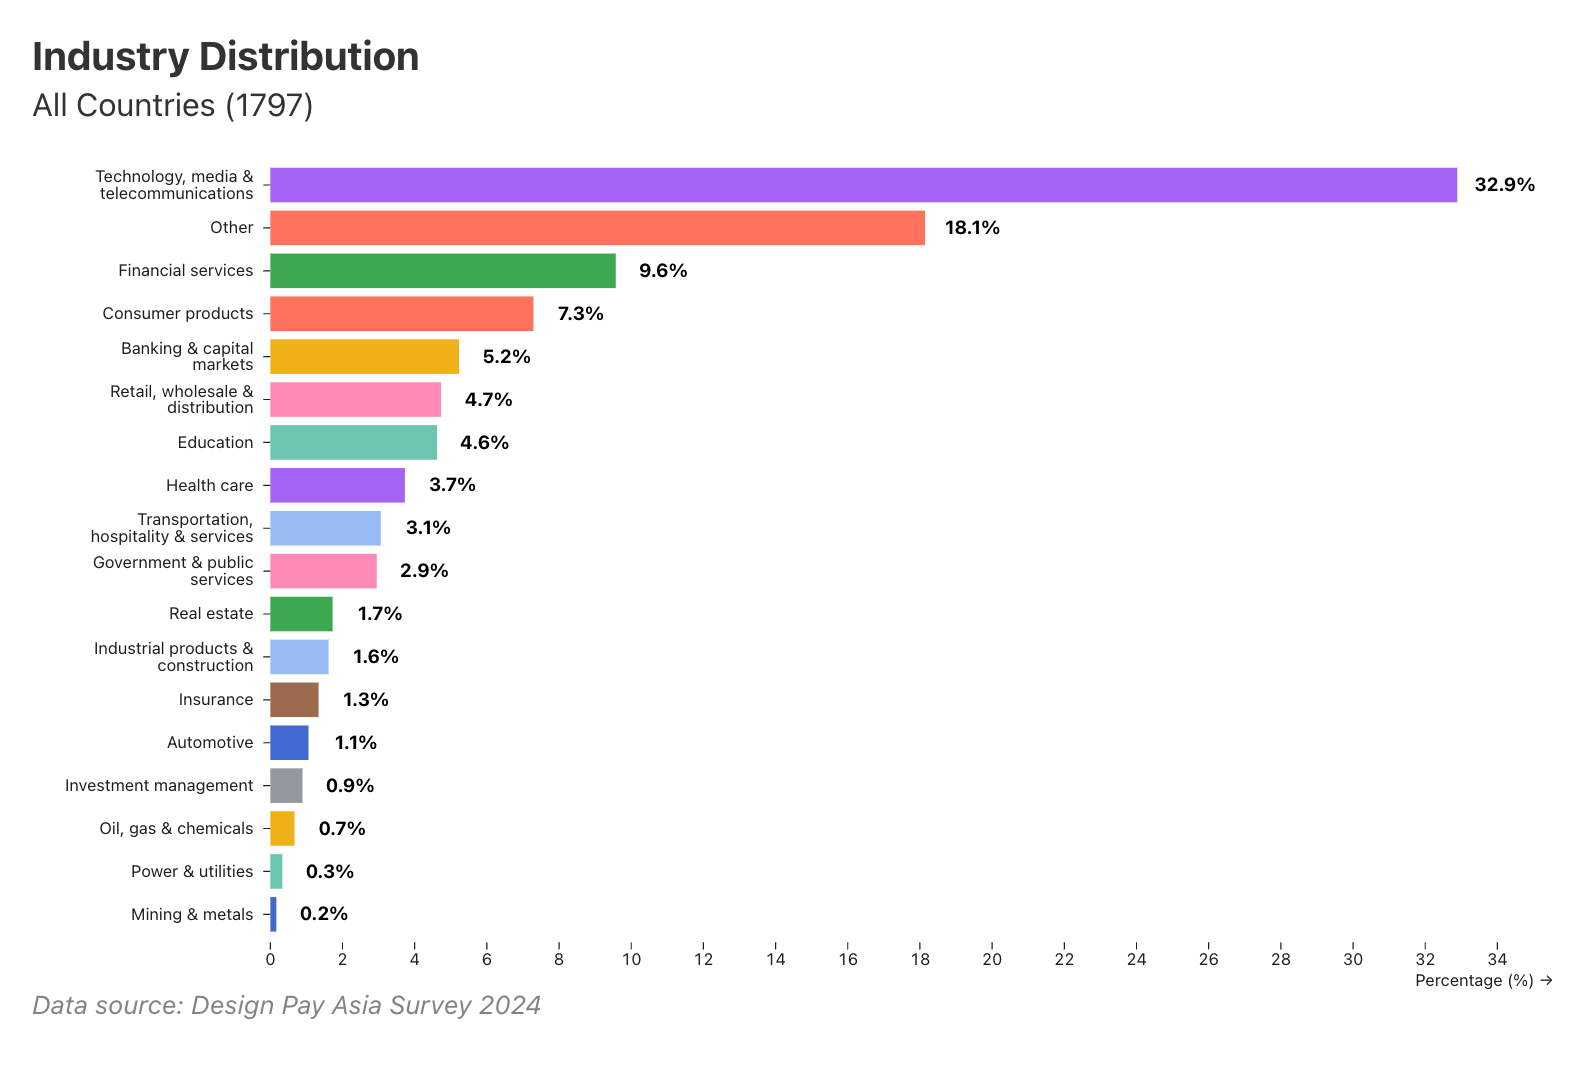
Industry distribution
Sector distribution of design employment across Southeast Asian markets. Based on N=1,797 responses.
Technology & Telecommunications leads at 32.8%, with financial services at 14.8% combined and an 18.1% 'other' category suggesting emerging sectors.
View data table
| Industry | Proportion |
|---|---|
| Technology & Telecommunications | 32.8% |
| Financial Services (combined) | 14.8% |
| Consumer Products | 7.3% |
| Essential Services | 8.3% |
| Other | 18.1% |
The field's centre of gravity sits at startups, working for tech.
Chart proof
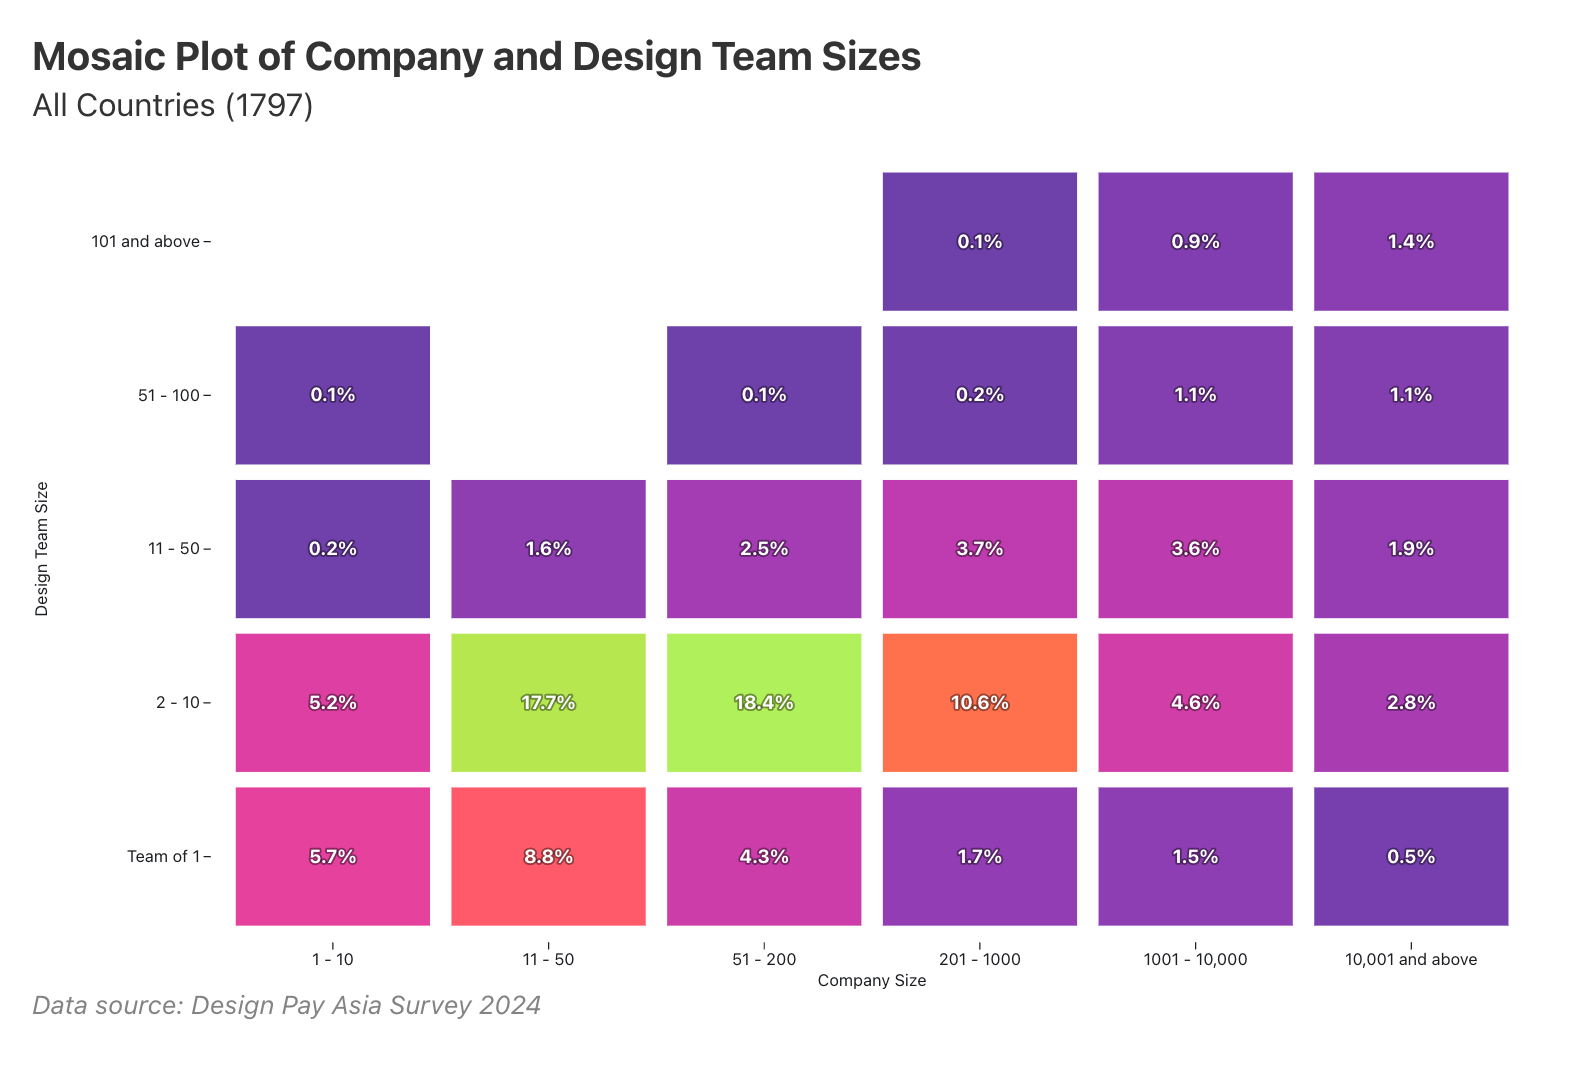
Mosaic plot of company and design team sizes
Relationship between company size and design team structure across respondents.
81.9% of design teams have fewer than 10 people; small teams (2–10) are most common at 59.3%, regardless of company size.
View data table
| Team size | Respondents (n) | Proportion |
|---|---|---|
| Solo designer | 406 | 22.6% |
| Small (2–10 people) | 1,065 | 59.3% |
| Mid-size (11–50) | 240 | 13.7% |
| Large (>50) | 86 | 4.4% |
Chart proof
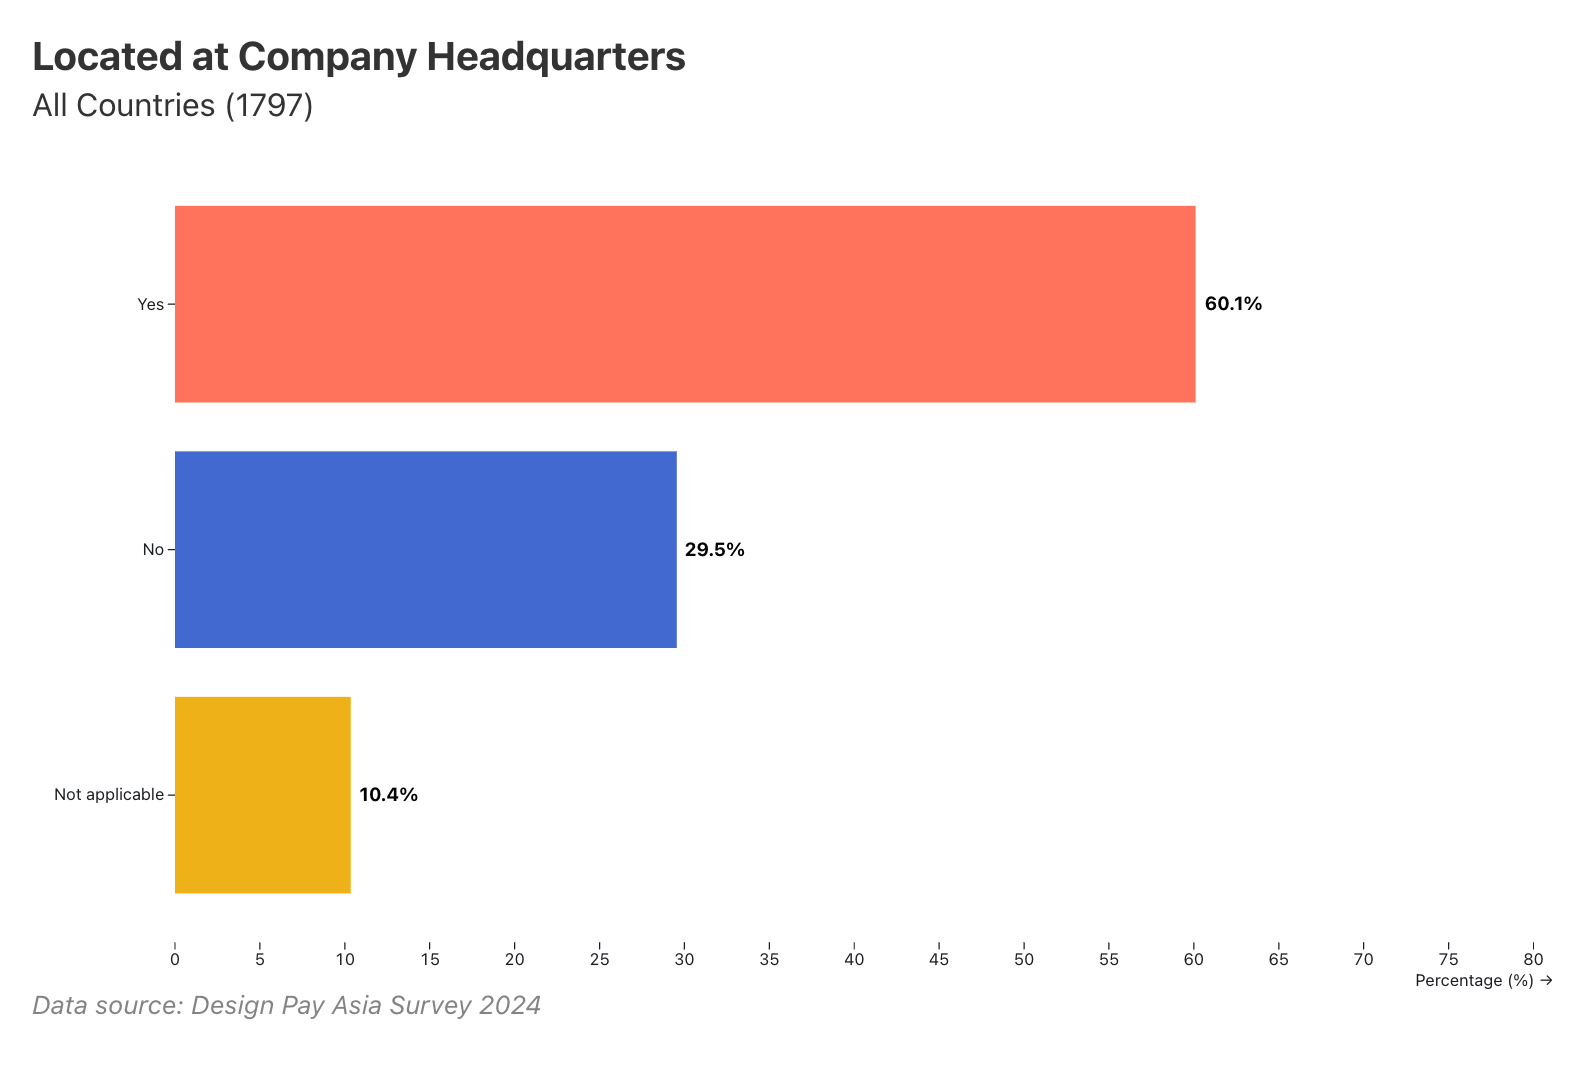
Located at company headquarters
Distribution of designers by office location: headquarters versus satellite or regional offices.
60.1% of designers are based at company headquarters, while 29.6% work from satellite or regional offices.
View data table
| Location type | Respondents (n) | Proportion |
|---|---|---|
| Headquarters | 1,080 | 60.1% |
| Satellite/Regional office | 531 | 29.6% |
| Not applicable | 186 | 10.4% |
Chart proof
Work model distribution
Work model comparison showing Singapore vs regional preferences.
Singapore strongly favours hybrid at 70.1% vs 36.0% regional. Remote is 14.4% SG vs 24.9% regional.
View data table
| Model | Respondents (n) | Share |
|---|---|---|
| Hybrid (SG) | 122 | 70.1% |
| Hybrid (Regional) | 645 | 36.0% |
| Remote (SG) | 25 | 14.4% |
| Remote (Regional) | 446 | 24.9% |
| Onsite (SG) | 27 | 15.5% |
| Onsite (Regional) | 706 | 39.0% |
In Singapore, hybrid is the default. Elsewhere in the region, onsite work still leads by a wide margin, even as employers experiment with flexibility as a hiring lever.
Financial services is where Singapore diverges most sharply from the rest of the region: 26.9% of its designers work in banking, insurance, or financial services, against 14.8% regionally — nearly double, and consistent with the city's role as a financial hub.
What this means for you
If you're a designer
- How do you balance being a generalist while keeping your specialist skills sharp?
- Could you benefit from new work models, like being a part-time design leader for multiple companies?
If you're leading a team or organisation
- Is doing more with less actually sustainable?
- How can you keep your team working well together when some are at home and others in the office?
- Are you measuring how smaller teams affect design quality and business results?
- What really drives your decisions about office work — employee preference, cost, or office space?
Evidence and further reading
Evidence used in this section
-
Companies dominated by startups and tech with lean design teams
Startup and tech companies account for 63.1% of respondents combined. Design teams are lean: 81.9% have fewer than 10 people, with 22.6% working as solo designers. Hybrid work is the most common at 36%, with 24.9% fully remote.
-
Singapore companies: higher enterprise presence, hybrid-dominant, financial hub
Singapore shows a more mature market with 32.8% enterprise (vs 20.8% regional), 21.8% startup (vs 30.3%), and 7.5% government (vs 4.9%). Industry: Financial services ecosystem at 26.9% combined across banking, insurance, financial services (vs 14.8% regional), Tech at 32.8%, Public sector 10.3%. Fewer solo designers at 13.8% (vs 22.6% regional). Larger average design team sizes. Hybrid work at 70.1% (vs 36% regional), remote at 14.4% (vs 24.9%).
Further reading and context
- Southeast Asian remote-capable employees: 53% expect hybrid, 24% fully remote
- 91% of global employees prefer either fully or almost remote work
- Hybrid work requires balancing flexibility with strengths-based alignment
- Technology industry leads with 67% of employees working primarily remotely
- Fractional leadership slower in Asia, expected to grow as startup ecosystem matures
Questions worth exploring
Will design teams in Southeast Asia grow larger as the industry matures, or stay lean by design?
Worth exploring next
- How will part-time leadership and subscription services change traditional jobs?
- What happens when designers become generalists instead of specialists?
- Who should make sure hybrid work actually works — design teams or someone else?
Where this sits in the conversation
-
Overview
2024 report -
Landscape
Demographics -
Landscape
Roles & experiences -
Landscape
Compensation -
Landscape
Company landscape you are here -
Sentiments
Offer & negotiation -
Sentiments
Career progression -
Sentiments
Value of design -
Sentiments
Job market -
Singapore deep dive
Singapore deep dive -
Close
The conversation continues
Commentary
How design teams are structured in companies suggests a landscape of lean, distributed teams.